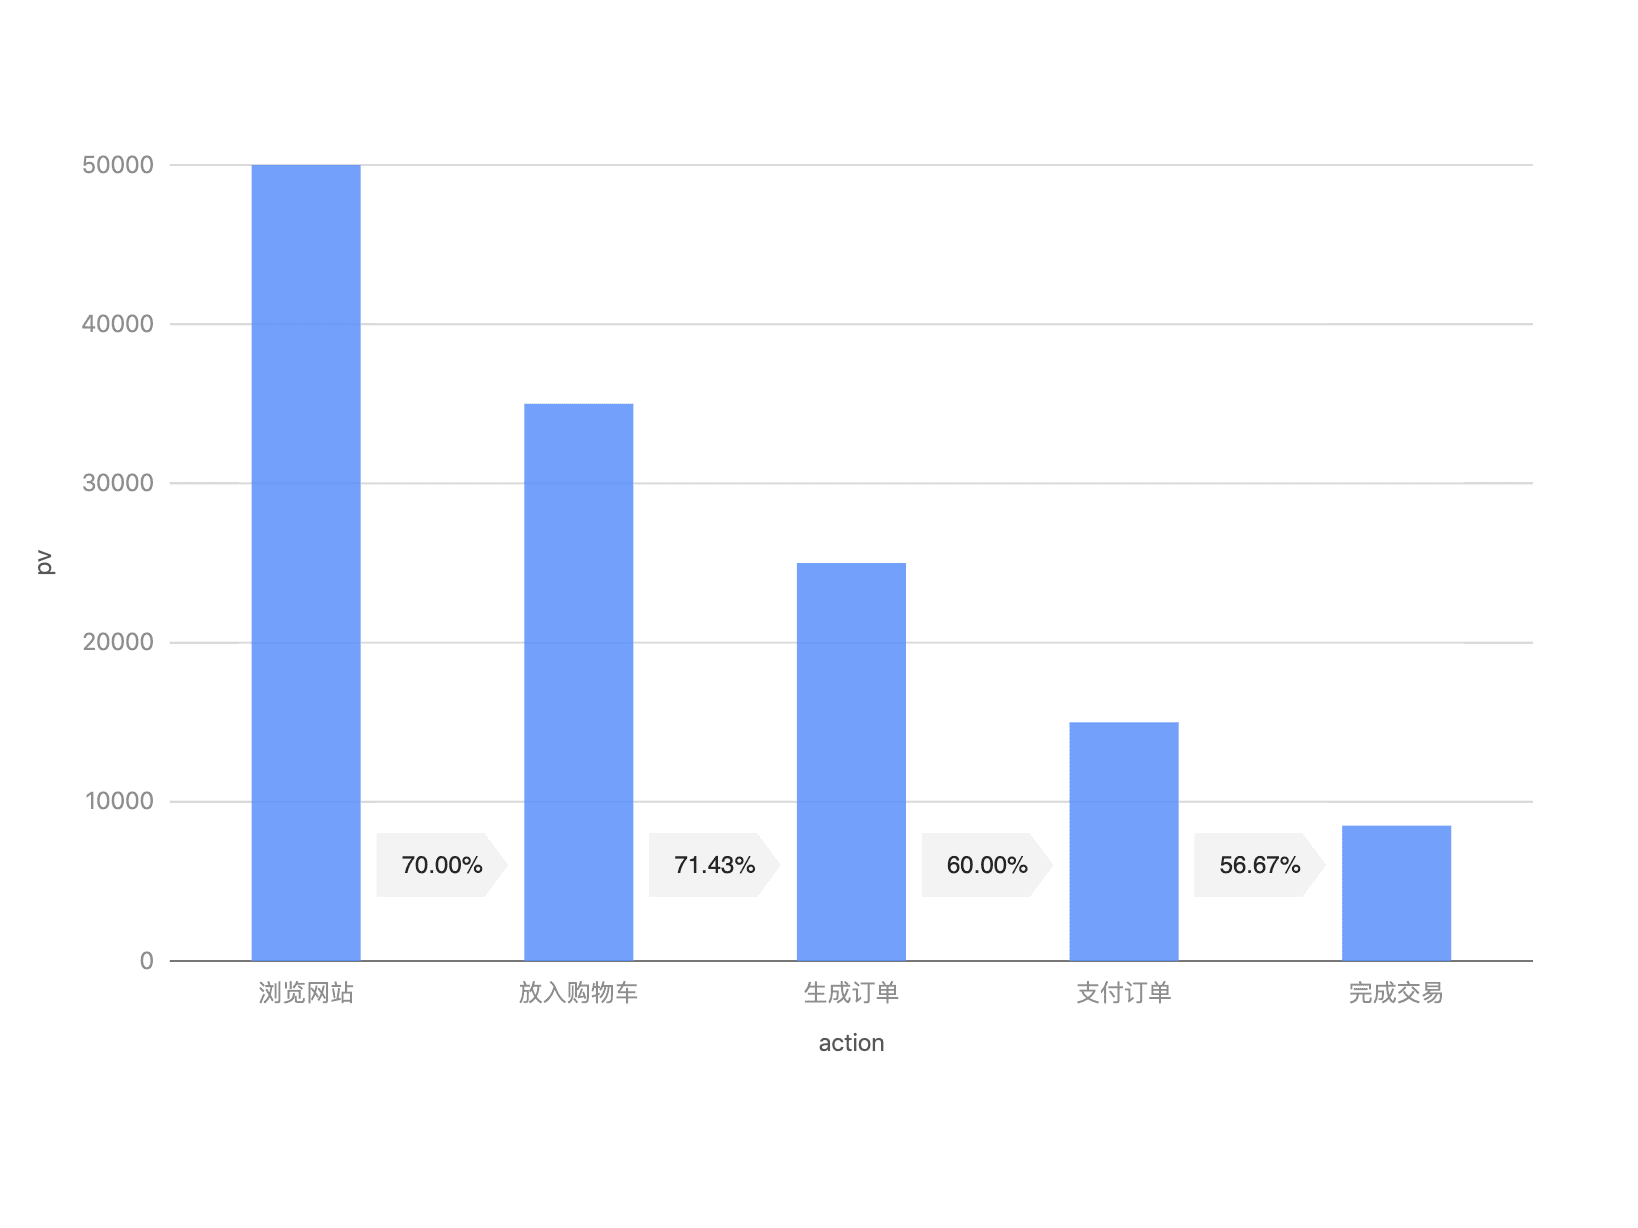
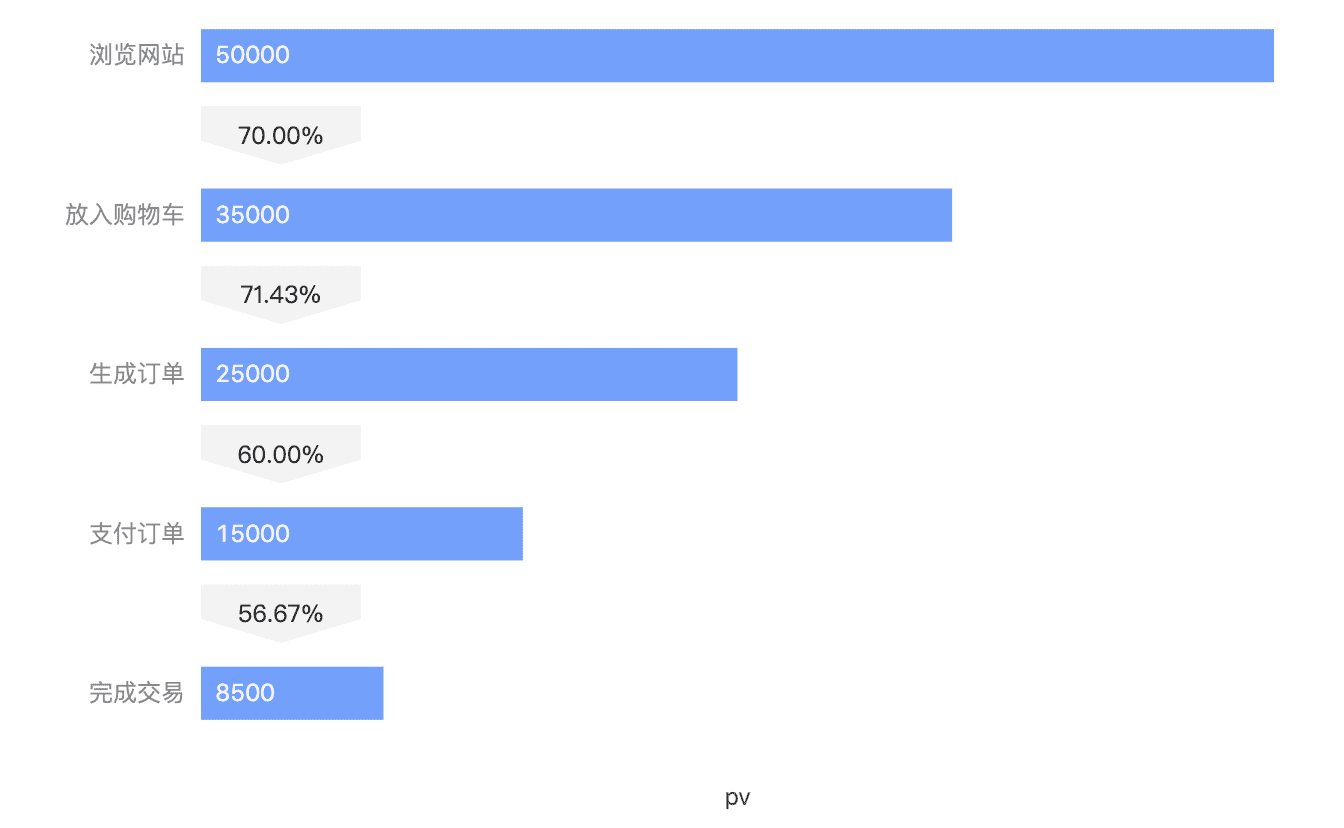
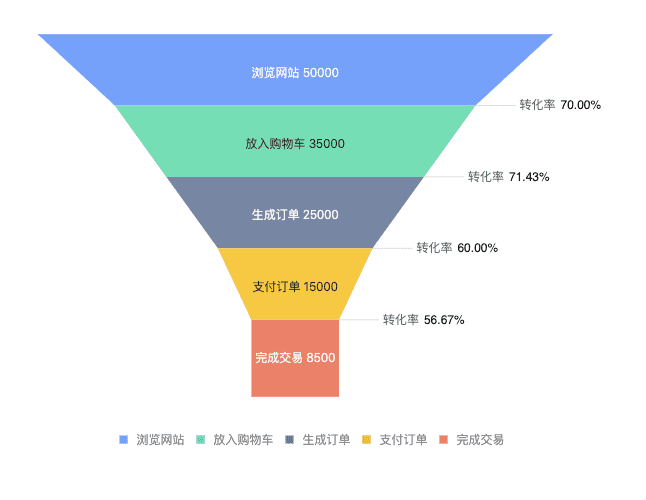
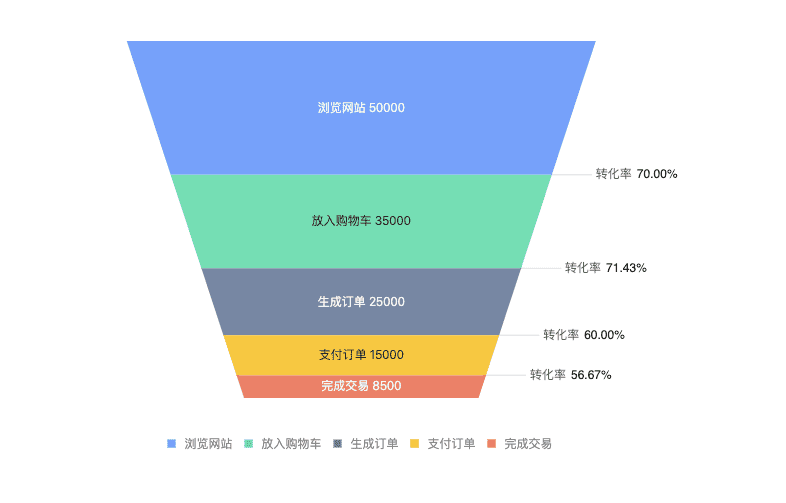
logoCreated with Sketch.

G2Plot

  • Manual
  • Examples
  • React Version
  • China Mirror
  • Productsantv logo arrow

    基础产品

    • G2

      G2Visualization Engine

      Data-driven visual language with a high level of usability and scalability
      Home PageExamples
    • G6

      G6Graph Visualization

      A Graph Visualization Framework in JavaScript
      Home PageExamples
    • F2

      F2Mobile Charts

      An elegant, interactive and flexible charting library for mobile
      Home PageExamples
    • L7

      L7Geospatial Visualization

      Large-scale WebGL-powered Geospatial Data Visualization
      Home PageExamples

    拓展产品

    • G2Plot

      G2PlotA Charting Library

      Pretty interactive charts out of box
      Home PageExamples
    • Graphin

      Graphin

      A react toolkit for graph analysis based on g6
      Home PageManual
    • ChartCube

      ChartCubeCharts Maker

      Create pretty charts without code
      Home PageCreate charts

    Ecosystem

    • Mohist Academy

      Mohist Academy

      Visualization Community
    • BizCharts

      BizCharts

      基于商业场景下的数据可视化解决方案
    • Viser

      Viser

      基于 G2 实现的可视化解决方案
  • Gallery
  • Line Charts
    • Line Chart
    • Multiple Line Chart
    • Marker Point
  • Step Charts
    • Basic StepLine Chart
    • Multiple StepLine Chart
  • Area Charts
    • Stacked Area Chart
    • Percent Stacked Area Chart
    • Area Chart
  • Column Charts
    • Column Chart
    • Stacked Column Chart
    • Percent Stacked Column Chart
    • Grouped Column Chart
    • Ranged Column Chart
    • Histogram Chart
    • Waterfall Chart
  • Bar Charts
    • Bar Chart
    • Stacked Bar Chart
    • Percent Stacked Bar Chart
    • Grouped Bar Chart
    • Range Bar Chart
  • Pie Charts
    • Pie Chart
    • Donut Chart
  • Rose Charts
    • Rose Chart
  • Scatter Charts
    • Scatter Chart
  • Bubble Charts
    • Bubble Chart
  • Radar
    • Radar Chart
  • Heatmap
    • DensityHeatmap Chart
    • Heatmap Chart
  • Funnel Charts
    • Funnel Chart
  • Treemap Charts
    • Treemap Chart
  • Liquid Charts
    • Liquid Chart
  • Gauge Charts
    • Gauge Chart
  • Bullet Chart
    • Bullet Chart
  • Calendar Chart
    • Calendar Chart
  • Sparkline
    • Sparkline
  • WordCloud
    • WordCloud Chart
  • Combo Charts
    • DualLine Combo Chart
    • Column-line Combo Chart
    • StackedColumn-line Combo Chart
    • GroupedColumn-line Combo Chart
  • General Configration of Charts
    • Title and Description
    • Dark Mode
    • Axis
    • Legend
    • Label
    • Set Padding
    • Set State
    • Guideline
    • Tooltip
  • Advanced
    • Charts Connection
    • Responsive Charts
Line Chart
Multiple Line Chart
Marker Point
Basic StepLine Chart
Multiple StepLine Chart
Stacked Area Chart
Area Chart
Percent Stacked Area Chart
Column Chart
Stacked Column Chart
Percent Stacked Column Chart
Grouped Column Chart
Ranged Column Chart
Histogram Chart
Waterfall Chart
Bar Chart
Stacked Bar Chart
Percent Stacked Bar Chart
Grouped Bar Chart
Range Bar Chart
Pie Chart
Donut Chart
Rose Chart
Scatter Chart
Bubble Chart
Radar Chart
DensityHeatmap Chart
Heatmap Chart
Funnel Chart
Treemap Chart
Liquid Chart
Gauge Chart
Bullet Chart
Calendar Chart
Sparkline
WordCloud Chart
DualLine Combo Chart
Column-line Combo Chart
StackedColumn-line Combo Chart
GroupedColumn-line Combo Chart
Title and Description
Dark Mode
Axis
Legend
Label
Set Padding
Set State
Guideline
Tooltip
Charts Connection
Responsive Charts

Gallery

Line Chart

  • basic Line chart

    basic Line chart

  • smooth Line chart

    smooth Line chart

  • Line chart with data point

    Line chart with data point

  • Line chart data point style

    Line chart data point style

  • Line chart with Slider

    Line chart with Slider

Multiple Line Chart

  • multiple Line chart

    multiple Line chart

  • multiple Line chart animation

    multiple Line chart animation

  • The causes of CO2 emissions

    The causes of CO2 emissions

  • set line color

    set line color

  • set line color through callback function

    set line color through callback function

  • setting line style

    setting line style

  • setting point marker active style

    setting point marker active style

Marker Point

  • Line chart with Marker Points

    Line chart with Marker Points

  • multi-type Marker Points

    multi-type Marker Points

  • Marker Points animation

    Marker Points animation

  • cutomized Marker Points

    cutomized Marker Points

  • Marker Points with image source

    Marker Points with image source

Basic StepLine Chart

  • basic StepLine chart

    basic StepLine chart

  • StepLine chart with data points

    StepLine chart with data points

  • StepLine chart with Slider

    StepLine chart with Slider

  • StepLine chart style

    StepLine chart style

Multiple StepLine Chart

  • mutiple StepLine Chart

    mutiple StepLine Chart

  • mutiple StepLine Chart label

    mutiple StepLine Chart label

Stacked Area Chart

  • StackedArea chart

    StackedArea chart

  • StackedArea chart - label

    StackedArea chart - label

  • StackedArea chart - line label

    StackedArea chart - line label

  • The causes of CO2 emissions

    The causes of CO2 emissions

Area Chart

  • basic Area chart

    basic Area chart

  • basic Area chart with Slider

    basic Area chart with Slider

Percent Stacked Area Chart

  • PercentStackedArea chart

    PercentStackedArea chart

Column Chart

  • Basic Column chart

    Basic Column chart

  • Column chart label

    Column chart label

  • Column chart label position

    Column chart label position

  • Column chart - auto adjust label color

    Column chart - auto adjust label color

  • 基础柱状图-缩略轴

    基础柱状图-缩略轴

  • Column Chart with Slider

    Column Chart with Slider

  • Column Chart with Conversion tag

    Column Chart with Conversion tag

Stacked Column Chart

  • StackedColumn chart

    StackedColumn chart

  • StackedColumn chart with Connected Area

    StackedColumn chart with Connected Area

  • Connected Area triggered on by mouse event

    Connected Area triggered on by mouse event

  • Connected Area style

    Connected Area style

  • StackedColumn chart - auto hide label

    StackedColumn chart - auto hide label

Percent Stacked Column Chart

  • PercentStackedColumn chart

    PercentStackedColumn chart

Grouped Column Chart

  • Grouped Column chart

    Grouped Column chart

  • Grouped Column chart with Slider

    Grouped Column chart with Slider

Ranged Column Chart

  • RangeColumn chart

    RangeColumn chart

  • RangeColumn chart label style

    RangeColumn chart label style

Histogram Chart

  • Histogram chart

    Histogram chart

  • Histogram chart

    Histogram chart

Waterfall Chart

  • Waterfall chart

    Waterfall chart

Bar Chart

  • Bar chart

    Bar chart

  • Bar chart - label position

    Bar chart - label position

  • Bar chart - auto adjust label color

    Bar chart - auto adjust label color

  • Bar chart - Scroll Bar

    Bar chart - Scroll Bar

  • Bar chart -  Conversion Tag

    Bar chart - Conversion Tag

Stacked Bar Chart

  • StackedBar chart

    StackedBar chart

  • StackedBar chart - auto hide label

    StackedBar chart - auto hide label

Percent Stacked Bar Chart

  • PercentStackedColumn chart

    PercentStackedColumn chart

Grouped Bar Chart

  • GroupedColumn chart

    GroupedColumn chart

Range Bar Chart

  • RangeColumn chart

    RangeColumn chart

  • RangeColumn chart - label style

    RangeColumn chart - label style

Pie Chart

  • basic Pie chart

    basic Pie chart

  • Pie chart - outter label

    Pie chart - outter label

  • Pie chart - outter label

    Pie chart - outter label

  • Pie chart - spider-layout label

    Pie chart - spider-layout label

Donut Chart

  • Donut chart

    Donut chart

  • Donut chart with statistic

    Donut chart with statistic

  • cutomized Pie chart

    cutomized Pie chart

Rose Chart

  • baisc Rose chart

    baisc Rose chart

  • StackedRose chart

    StackedRose chart

  • GroupedRose chart

    GroupedRose chart

Scatter Chart

  • basic Scatter chart

    basic Scatter chart

  • the color mapping of Scatter chart

    the color mapping of Scatter chart

  • Scatter chart with Trend Line

    Scatter chart with Trend Line

  • Scatter chart label

    Scatter chart label

Bubble Chart

  • Bubble chart

    Bubble chart

  • Bubble chart with Quadrant

    Bubble chart with Quadrant

  • Bubble chart with Trend Line

    Bubble chart with Trend Line

  • Bubble Chart with Time Line

    Bubble Chart with Time Line

Radar Chart

  • Rardar chart

    Rardar chart

  • multiple Rardar chart

    multiple Rardar chart

DensityHeatmap Chart

  • DensityHeatmap chart

    DensityHeatmap chart

  • DensityHeatmap chart with background

    DensityHeatmap chart with background

Heatmap Chart

  • Heatmap chart

    Heatmap chart

  • Heatmap chart shape type

    Heatmap chart shape type

  • Heatmap chart size mapping

    Heatmap chart size mapping

  • Heatmap chart mode transform

    Heatmap chart mode transform

Funnel Chart

  • Funnel chart

    Funnel chart

  • Funnel chart - dynamic height

    Funnel chart - dynamic height

  • mirror Funnel chart

    mirror Funnel chart

  • transposed Funnel chart

    transposed Funnel chart

  • transposed dynamic-height Funnel chart

    transposed dynamic-height Funnel chart

  • transposed mirror Funnel chart

    transposed mirror Funnel chart

Treemap Chart

  • Treemap chart

    Treemap chart

  • Treemap chart label

    Treemap chart label

  • Treemap chart drilldown interaction

    Treemap chart drilldown interaction

Liquid Chart

  • Liquid chart

    Liquid chart

  • Liquid chart - show percent

    Liquid chart - show percent

Gauge Chart

  • basic Gauge chart

    basic Gauge chart

  • cutomized Gauge chart

    cutomized Gauge chart

  • MeterGauge chart

    MeterGauge chart

  • FanGauge chart

    FanGauge chart

Bullet Chart

  • Bullet chart

    Bullet chart

  • Bullet chart with multiple color range

    Bullet chart with multiple color range

  • Bullet chart - over the target

    Bullet chart - over the target

  • Bullet chart - multiple targets

    Bullet chart - multiple targets

  • stacked Bullet chart

    stacked Bullet chart

  • grouped Bullet chart

    grouped Bullet chart

  • Bullet chart with color range

    Bullet chart with color range

Calendar Chart

  • Calendar chart

    Calendar chart

Sparkline

  • TinyColumn x TinyLine x RingProgress

    TinyColumn x TinyLine x RingProgress

  • TinyArea x Progress

    TinyArea x Progress

WordCloud Chart

  • Wordcloud chart

    Wordcloud chart

DualLine Combo Chart

  • Basic Dual-line Combo Chart

    Basic Dual-line Combo Chart

  • Dual-line Combo Chart - customize line style

    Dual-line Combo Chart - customize line style

  • Dual-line Combo Chart - use the same scale

    Dual-line Combo Chart - use the same scale

Column-line Combo Chart

  • Basic Column-line Combo Chart

    Basic Column-line Combo Chart

  • Column-line Combo Chart - customize graphic style

    Column-line Combo Chart - customize graphic style

  • Column-line Combo Chart - disable y axis colorMapping

    Column-line Combo Chart - disable y axis colorMapping

  • Column-line Combo Chart - multiple line

    Column-line Combo Chart - multiple line

StackedColumn-line Combo Chart

  • StackedColumn-line Combo Chart

    StackedColumn-line Combo Chart

  • StackedColumn-line Combo Chart - multiple line

    StackedColumn-line Combo Chart - multiple line

GroupedColumn-line Combo Chart

  • GroupedColumn-line Combo Chart

    GroupedColumn-line Combo Chart

  • GroupedColumn-line Combo Chart - multiple line

    GroupedColumn-line Combo Chart - multiple line

Title and Description

  • the title and sub-title of chart

    the title and sub-title of chart

  • chart's title and sub-title style

    chart's title and sub-title style

Dark Mode

  • set dark theme

    set dark theme

Axis

  • Axis tick count

    Axis tick count

  • min max value of Axis

    min max value of Axis

  • Axis title

    Axis title

  • Axis style

    Axis style

Legend

  • Legend position

    Legend position

  • Legend fliping pages

    Legend fliping pages

Label

  • Label text formatting

    Label text formatting

  • Label style

    Label style

  • Label position offset

    Label position offset

Set Padding

  • set inner padding

    set inner padding

Set State

  • active state of chart

    active state of chart

  • active state of chart

    active state of chart

  • disable state of chart

    disable state of chart

  • disable state of chart

    disable state of chart

  • selected state of chart

    selected state of chart

  • selected state of chart

    selected state of chart

Guideline

  • guideline-style.js

    guideline-style.js

  • statistic Guide Line

    statistic Guide Line

  • cutomized Guide Line

    cutomized Guide Line

Tooltip

  • Tooltip inner chart

    Tooltip inner chart

  • sorting tooltip value dynamicly & add statistic value

    sorting tooltip value dynamicly & add statistic value

  • tooltip as table

    tooltip as table

Charts Connection

  • muti-charts communication

    muti-charts communication

Responsive Charts

  • responsive chart - axis

    responsive chart - axis

  • responsive chart - label

    responsive chart - label

G2Visualization Engine

Home Page
Examples
Manual
Changelog
GitHub Repository
🇨🇳China Mirror

G6Graph Visualization

Home Page
Examples
Manual
API
Changelog
GitHub Repository
🇨🇳China Mirror

F2Mobile Charts

Home Page
Examples
Manual
API
Changelog
GitHub Repository
🇨🇳China Mirror

L7Geospatial Visualization

Home Page
Examples
Manual
API
Changelog
GitHub Repository
🇨🇳China Mirror

G2PlotA Charting Library

Home Page
Examples
Manual
Changelog
GitHub Repository
🇨🇳China Mirror

Graphin

Home Page
Manual
API
Changelog
GitHub Repository
🇨🇳China Mirror

ChartCubeCharts Maker

Home Page
Create charts
Yuque
DingTalk Group

more products更多产品

Ant DesignAnt Design-企业级 UI 设计语言
yuque语雀-知识创作与分享工具
yunfengdie云凤蝶-中台建站平台
EggEgg-企业级 Node 开发框架
kitchenKitchen-Sketch 工具集
xtech蚂蚁体验科技
About usOld site
© 2020 Made with ❤ by XTech